Last Updated on 10 April 2023 by automiamo.com
When investing in the long term I first look the bond market before leaping in the stocks.
Few, simple and important rules to follow:
- Higher Bond yields = Lower Bond Prices = Bottom in the bond market is more bottom
- Short-term and mid-term bond yields are closing to long-term yields (example 2-Year yield = 10-Year yield) = this means flattening = not good for long-term investment. Stay alerting for your paper profits.
- Short-term and mid-term bond yields are greater than long-term yields (example 2-Year yield is greater than 10-Year yield) = this means inversion = NOT GOOD, imminent fear of recession. Remember: stock market does not perform well during recessions.
- Short-term and mid-term bond yields are less than long-term yields (example 2-Year yield is less than 10-Year yield and going lower) = this means steepening. That’s fine, economics sounds good for long-term investments.
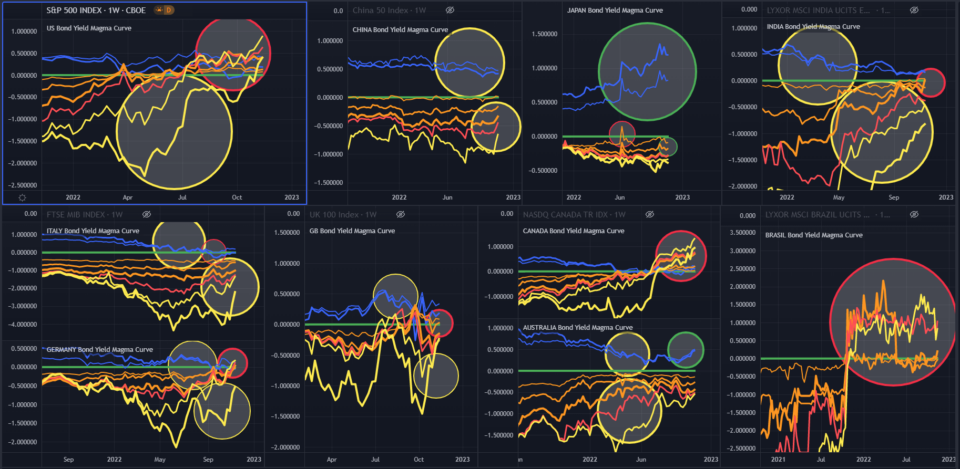
Looking at the figure above: United States, Canada, Brazil are countries with the most prolongated inversions in the bond yields (highlighted with red circles).
Last but not least rule.
5. More prolongated inversion = not good, twice.
Flattening areas (yellow circles) have to be carefully monitored.
Good perspective (green circles) looking for Japan long-term and mid-term yield curves are steepening. The same good news for Australia.
Giancarlo Pagliaroli
Disclaimer: The information and publications are not meant to be, and do not constitute, financial, investment, trading, or other types of advice or recommendations supplied or endorsed by me.