Last Updated on 14 January 2024 by automiamo.com
UPDATE! My free indicator of correlations available on Tradingview.
My layout of correlations by giancarlopagliaroli on TradingView.com
Usage of correlations
Always I monitor correlations when I make trading on more assets, at the same time.
Correlation is a measure that defines how different assets move in relation to one another.
The more the correlation coefficient is, the more they are aligned closely.
I check this using my dashboard on Tradingview, at monthly, weekly, daily charts.
An example use case is below:
- I want to go short now S&P500. “Green light” from my Strategy A
- I want to go short now BTCUSD. “Green light” from my Strategy B
Monthly correlation between S&P500 and BTCUSD (using 1-D chart and correlation length = 20) is 95%. Too high!
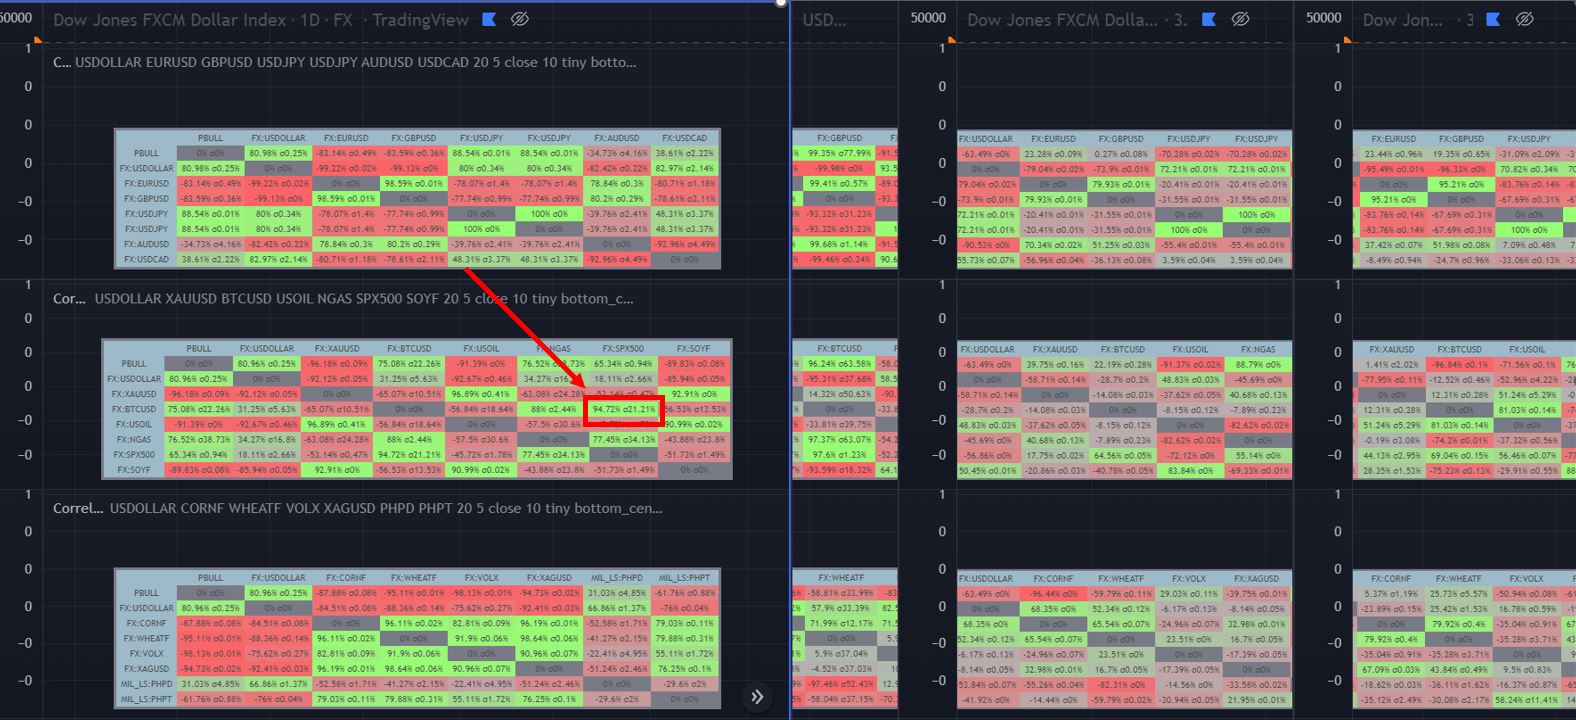
Then, weekly correlation between S&P500 and BTC/USD (using 1-D chart and correlation length = 5 days) is 98%. Again, too high!
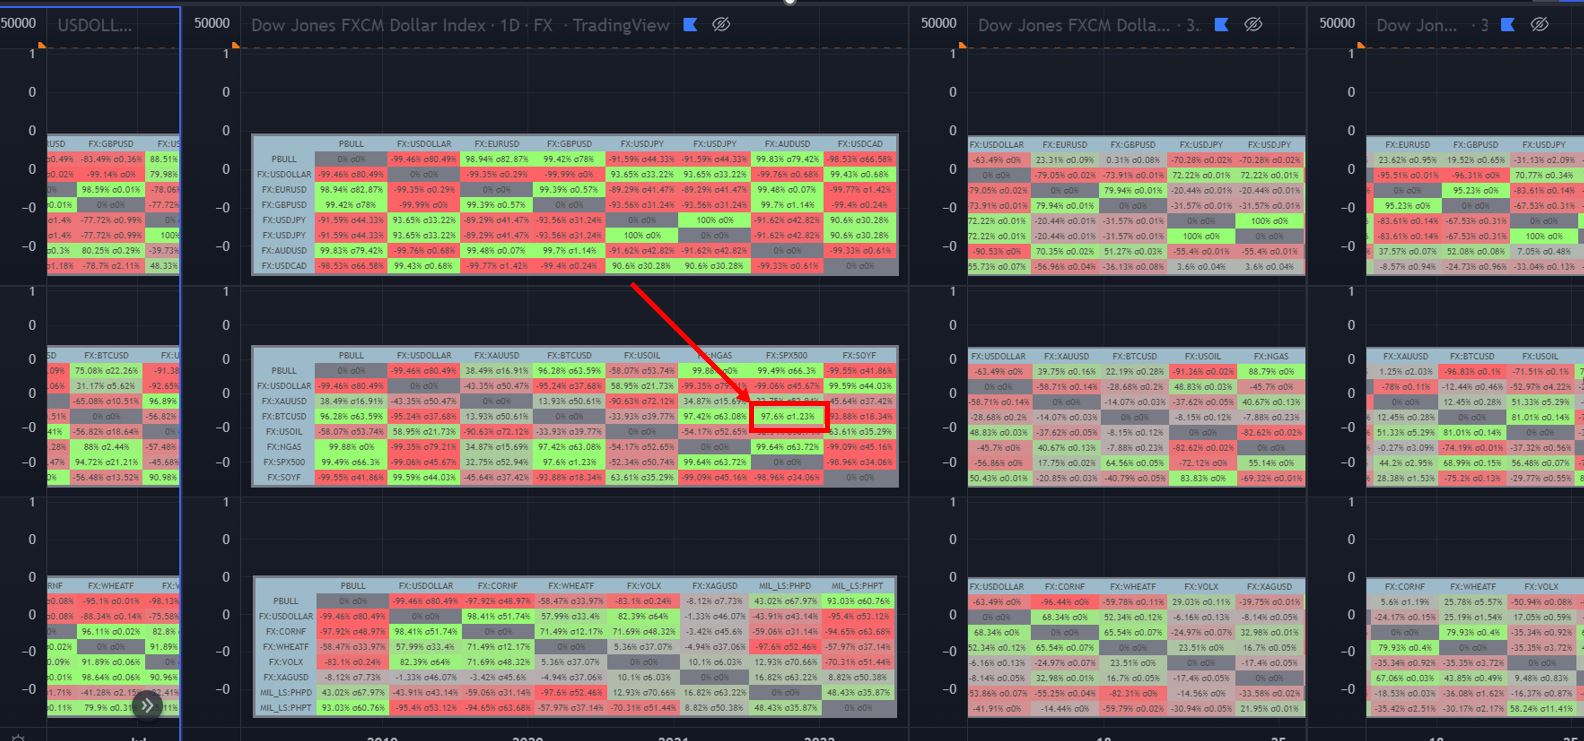
The correlation between these two assets is too high and will move in tandem, so preferring to go short on one asset, not both.
Furthermore, each strategy is not perfect and if I lose one trade I can lose twice.
I go short only one asset on which I am more confident with my strategy and odds.
Good diversification is when trading more assets having low correlation
Giancarlo Pagliaroli
Disclaimer: The information and publications are not meant to be, and do not constitute, financial, investment, trading, or other types of advice or recommendations supplied or endorsed by me.
Changes in the USD are not exogenous, I mean S&P500 up and USD down, or viceversa. For example, an increase in US productivity (compared to the productivity of firms in other countries) will both increase the S&P and valuate the USD.
Need to separate different effects, which is virtually impossible – or look for random variation in the USD.
So I prefer decorrelation during multi-asset trading.
My dashboards with correlations on Tradingview:
Commodities and Currencies: https://www.tradingview.com/chart/nKXMNH4g/
Stocks and Financials: https://www.tradingview.com/chart/8pUt7T3Q/
changing in correlation between china and US stocks by giancarlopagliaroli on TradingView.com
Just created a new indicator. You can find this indicator in Tradingview, Tab indicator & strategies, by typing gCorrelations